Choosing a server monitoring SaaS provider
Having graphs available for historical and current trends for critical service metrics is quite important in my experience.
They help understand performance bottlenecks as well as interconnections between different parts of a multi-server infrastructure.
We’ve decided to replace our Cacti installation with a “cloud” solution mainly due to the complexity of configuring cacti in an automated manner.
 While Percona’s cacti templates are great, setting them up requires manual intervention.
Let’s not talk about adding custom metrics to cacti.
While Percona’s cacti templates are great, setting them up requires manual intervention.
Let’s not talk about adding custom metrics to cacti.
We’ve evaluated New Relic, Server Density, Scout and CopperEgg. All of these tools let you install an agent on your servers which collects data and sends it back to the provider where you can view graphs, configure alerts etc. They mainly differ in the ways they allow you to plot metrics and create dashboard as well as how you can collect your own data.
 We’ve decided to give CopperEgg a try because of the 5 seconds time resolution and the nice HTTP API with which one can add metrics and dashboards in a fully automated fashion.
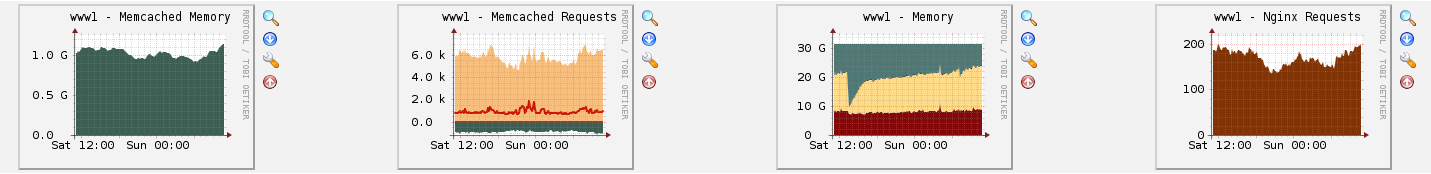
Collecting data from mysql, gearman, memcached etc.
Let’s divide server metrics into three categories based on where the data comes from:
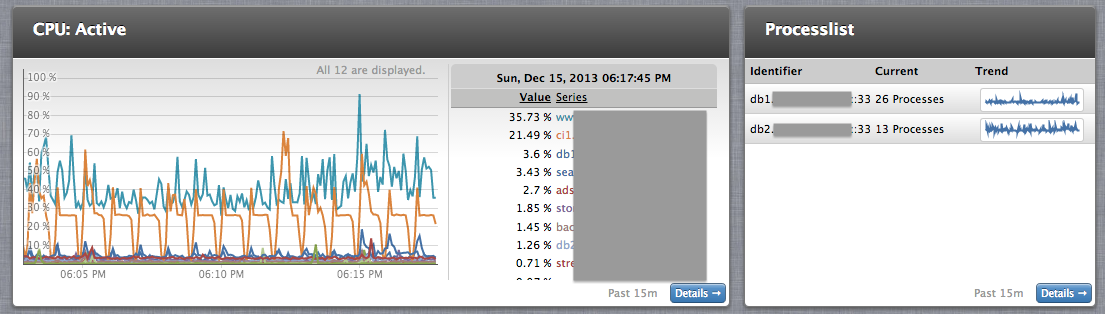
- Operating system: cpu load, network throughput, running processes.
- Popular databases and other services: mysql, redis, apache, etc.
- Custom application: email queue backlog size, conversion rates etc.
Most monitoring tools know how to collect data from the first group out of the box. For collecting data for popular services they usually provide a plugin directory site, where companies and users can share their collector scripts. Our impression was that these scripts oftentimes are outdated, unmaintained or missing import metrics. Additionally they lead to vendor lock-in because they can only talk to one monitoring platform. This especially becomes a problem if you’d like to collect custom metrics from your own (or unpopular) services.
That’s why we’ve created bipbip, an agent written in ruby which can collect metrics from a range of services and send it back to a monitoring platform (so far only CopperEgg is implemented).
Built in are collectors for apache, gearman, memcached, mysql, netstat, nginx, php-apc and redis.
One can write a custom collector by extending the base class Bipbip::Plugin and implementing metrics_schema and monitor.
To collect some random data you could write the following plugin:
module Bipbip

  class Plugin::Example < Plugin

    def metrics_schema
      [
          {:name => 'random_number_1', :type => 'gauge', :unit => 'Items'},
          {:name => 'random_number_2', :type => 'gauge', :unit => 'Items'},
      ]
    end

    def monitor
      random = Random.new
      {
          :random_number_1 => random.rand(1..10),
          :random_number_2 => random.rand(1..100),
      }
    end
  end
end
Bipbip will fork a separate process to collect that random data so that other metrics are not delayed should your random number generator be slow.
Hopefully this little tool helps someone in need for services monitoring. How do you monitor your servers?